Getting Started with Front End Testing
We all know that testing is important, your project can’t be run unless all your unit and integration tests are written (and pass), but we often forget about testing the front end. There are so many different tests we need to be running on the front end - accessibility testing, performance testing, user testing, HTML validation, visual regression testing - it’s hard to work out what you need to test for and where to start.
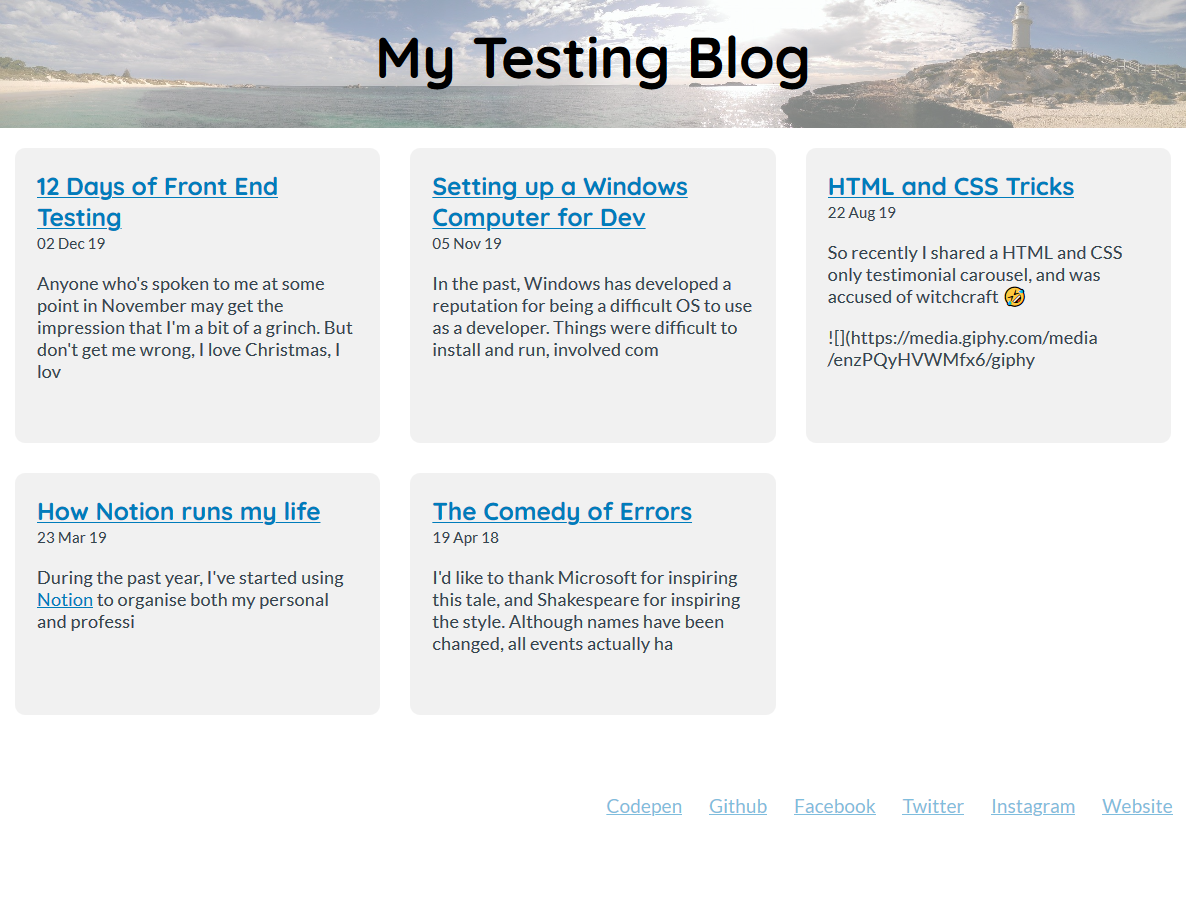
To help you get started, I’m going to showcase a few different tests for accessibility, visual regression and end-to-end testing as well as linting, all run on a blog using Express with Contentful as a headless CMS. Most of these tools are language agnostic so you can integrate them with whatever stack and workflows you use. If you’re looking for more options, there’s a list of more testing tools and resources in Twelve Days of Front End Testing from 24ways last year.
Linting
Although not technically testing, linting and code formatters goes a long way in catching errors before a test would (as well as making your code cleaner and easier to read). You can integrate them as part of your build tool or deployment pipeline, or run them directly in your IDE.
If you’re using VS Code, install the ESLint (or TSLint if you’re using Typescript) for JS and Stylelint for your CSS/Sass files and it will use the config files you have in your project (eg. .eslintrc and .stylelintrc).
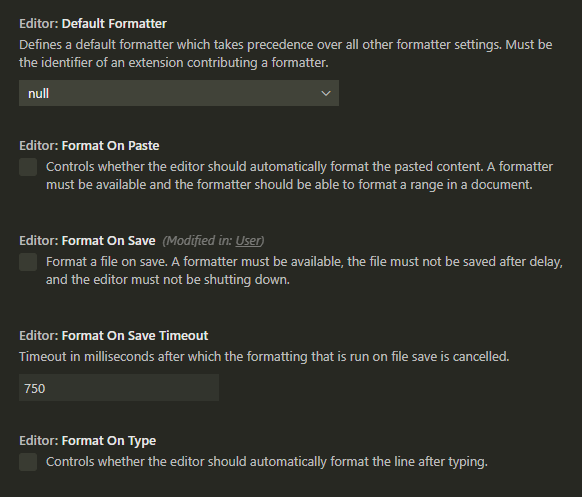
Under the VS Code Settings you can then define when to automatically format a file.
Linting is a fairly personal choice (although tabs are the right option, they’re actually better for accessibility), but you can find some starter files on GitHub.
Accessibility Testing
For accessibility (a11y) testing, pa11y is a good place to start. They have a suite of open source tools that you can run via command line, as part of your deployment pipeline and include a web dashboard to track improvements and regressions.
Out of the box the pa11y command line tool runs over your site with the WCAG2AA standards and can then log the results.
// ./tests/pa11y.json
// Require modules for running
const pa11y = require('pa11y')

const runTest = async () => {
    const results = await Promise.all([
        // Basic pa11y test with no options
        pa11y(`http://localhost:65519`),
    ])

    // Display Results
    console.log(results)
}

runTest()
You can then run this test via the command line by running the test file.
node tests/pa11y.js
Note: If you’re using WSL on Windows, Puppeteer has a few issues with running. You can force it to use the Windows version of Chrome by adding the following code to your test file:
// Require the Puppeteer package
const puppeteer = require('puppeteer-core');

//Define the browser settings at the start of your runTest function
const browser = await puppeteer.launch({
    ignoreHTTPSErrors: true,
    executablePath: '/mnt/c/Program Files (x86)/Google/Chrome/Application/chrome.exe',
    args: ['--no-sandbox'],
})

// Define the browser option in the pa11y function
pa11y('https://localhost:65519', {
    browser: browser
})

// Close the browser at the end of your function
browser.close()
To make it a bit easier to check the results, you can save them to a file instead of printing to the console. By default pa11y gives the results in json format, but you can change this and customise it to give a more user-friendly HTML report instead
// Also require the `file-system` package
const fs = require('file-system')

// Replace the console.log of results with saving to a file
fs.writeFile('tests/results/pa11y.json', JSON.stringify(results), err => {
    console.log(err)
})
The results pa11y gives you will include a code snippet to show where the error occurred as well as the WCAG guideline that the error occurred on. If the error message it gives isn’t clear on what the issue is, you can find a full list of the WCAG guidelines and search for the error code
[
    {
        "documentTitle": "My Testing Blog",
        "pageUrl": "http://localhost:65519/",
        "issues": [
            {
                "code": "WCAG2AA.Principle3.Guideline3_1.3_1_1.H57.2",
                "type": "error",
                "typeCode": 1,
                "message": "The HTML element should have a lang or xml:lang attribute which describes the language of the document.",
                "context": "<HTML><head>\n\t\t<meta charset=\"utf-8\">...</HTML>",
                "selector": "HTML",
                "runner": "htmlcs",
                "runnerExtras": {}
            }
        ]
    }
]
For example, the error given in the report above is for the guideline 3.1.1, you can search on the page of the full list of guidelines for the guideline number given at the end, eg. 3_1.3_1_1.H75.2

By default pa11y tests against the WCAG (Web Content Accessibility Guidelines) 2.0 AA standard, you can change this by defining a [standard option](https://github.com/pa11y/pa11y#standard-string) in the pa11y function. You can also set a path on the [screenCapture option](https://github.com/pa11y/pa11y#screencapture-string) and pa11y with take a screenshot during the test and save it, this is useful when trying to work out why pa11y is giving a particular error. A full list of options is available in the pa11y repository.
pa11y(`http://localhost:65519`, {
    browser: browser,
    standard: 'WCAG2AAA',
    screenCapture: `${__dirname}/results/pa11y_home.png`,
}),
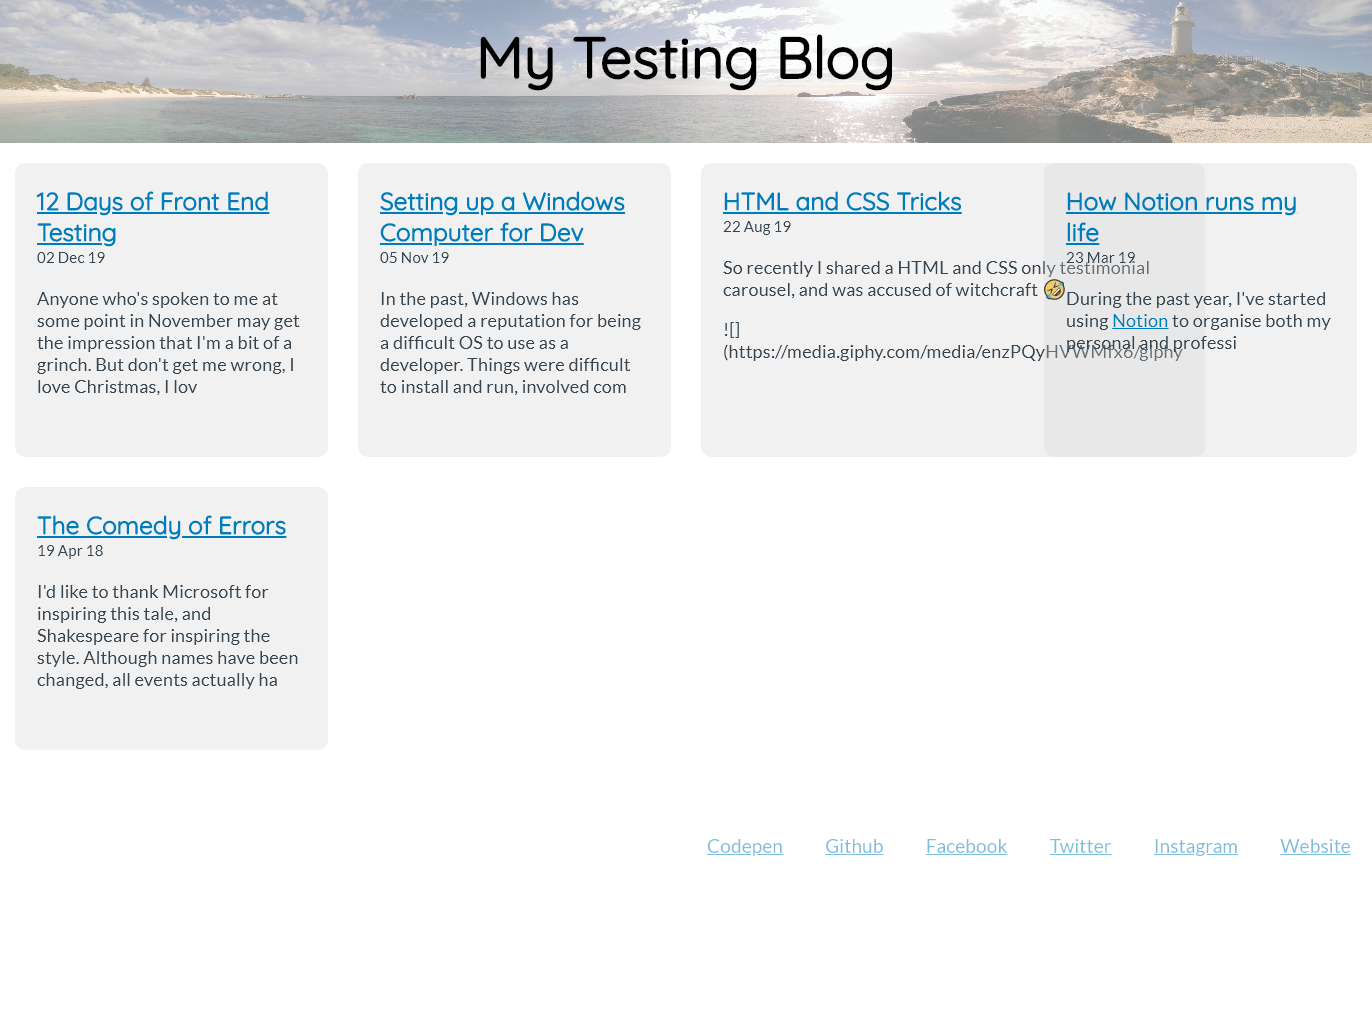
Saving a screenshot can be useful to work out what pa11y was rendering when running the test, as the page may be displaying differently to how you’d expect.
You can also check multiple pages and screen sizes and run multiple tests by adding to the promise array in your test function. You can define the viewport for each test (to test various screen sizes) different pages of your application.
const results = await Promise.all([
        pa11y(`http://localhost:65519`, {
            browser: browser,
            standard: 'WCAG2AAA',
            screenCapture: `${__dirname}/results/pa11y_home_desktop.png`,
            viewport: {
                width: 1280,
                height: 1024,
            },
        }),
        pa11y(`http://localhost:65519`, {
            browser: browser,
            standard: 'WCAG2AAA',
            screenCapture: `${__dirname}/results/pa11y_home_mobile.png`,
            viewport: {
                width: 320,
                height: 480,
                isMobile: true,
            },
        }),
        pa11y(`http://localhost:65519/blog-post`, {
            browser: browser,
            standard: 'WCAG2AAA',
            screenCapture: `${__dirname}/results/pa11y_post.png`,
        }),
    ])
Visual Regression Testing
Even if you’re the only developer working on a project, it’s still easy to make code changes that bleed into other areas of your application (I’ve been know to do that at times 😬). Visual regression testing can help stop that, and highlight any areas of your application that are visually different from before.
BackstopJS is a good tool for running this, because it gives you starter config so you can hit the ground running. If you install backstop globally (npm install -g backstopjs), you can run their initialization command (backstop init) in your project folder and it’ll create all the files for you, including the backstop.json config file.
{
  "id": "backstop_default",
  "viewports": [
    {
      "label": "phone",
      "width": 320,
      "height": 480
    },
    {
      "label": "tablet",
      "width": 1024,
      "height": 768
    }
  ],
  "onBeforeScript": "puppet/onBefore.js",
  "onReadyScript": "puppet/onReady.js",
  "scenarios": [
    {
      "label": "BackstopJS Homepage",
      "cookiePath": "backstop_data/engine_scripts/cookies.json",
      "url": "http://localhost:65519",
      "referenceUrl": "",
      "readyEvent": "",
      "readySelector": "",
      "delay": 0,
      "hideSelectors": [],
      "removeSelectors": [],
      "hoverSelector": "",
      "clickSelector": "",
      "postInteractionWait": 0,
      "selectors": [],
      "selectorExpansion": true,
      "expect": 0,
      "misMatchThreshold": 0.1,
      "requireSameDimensions": true
    }
  ],
  "paths": {
    "bitmaps_reference": "backstop_data/bitmaps_reference",
    "bitmaps_test": "backstop_data/bitmaps_test",
    "engine_scripts": "backstop_data/engine_scripts",
    "html_report": "backstop_data/html_report",
    "ci_report": "backstop_data/ci_report"
  },
  "report": [
    "browser"
  ],
  "engine": "puppeteer",
  "engineOptions": {
    "args": [
      "--no-sandbox"
    ]
  },
  "asyncCaptureLimit": 5,
  "asyncCompareLimit": 50,
  "debug": false,
  "debugWindow": false
}
"engine": "puppeteer",
  "engineOptions": {
    "args": [
      "--no-sandbox"
    ],
    "executablePath": "/mnt/c/Program Files (x86)/Google/Chrome/Application/chrome.exe"
  },
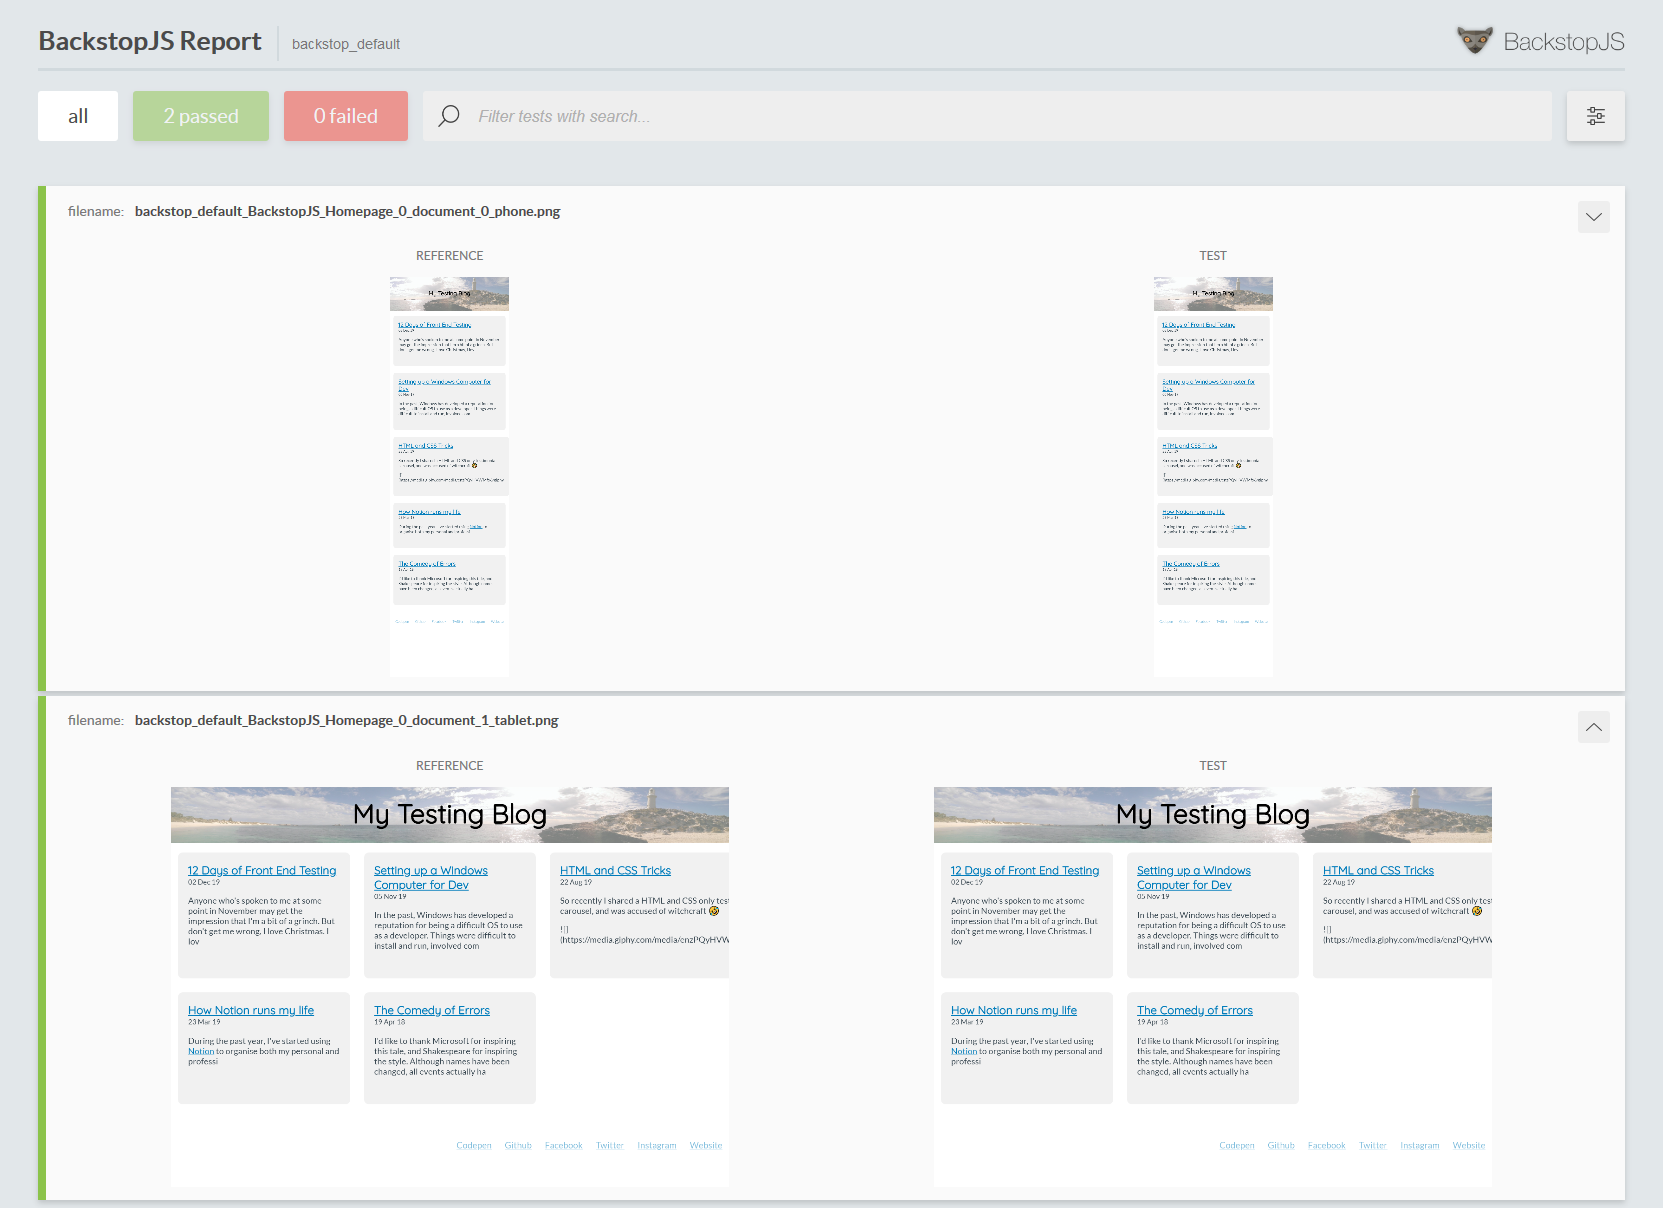
Run the test using the backstop test command and it will save the results in the backstop_data/bitmaps_test folder under a separate folder for each test and launch a HTML report with the results. The first time you run the test it will fail as it doesn’t have anything to compare it to, set the default screenshots by running backstop approve and run the test again.
You can change the config to suit your requirements, more information about the options is available in the Backstop documentation, for example you may want to change the misMatchThreshold so that it doesn’t flag for slight pixel fluctuations.
End to End Testing
If visual regression testing is a bit too touchy for you, end to end testing might be a better solution (when you don’t need to make sure every pixel is exactly the same, but you do need to know that elements are on the page and clicking on things does what it should).
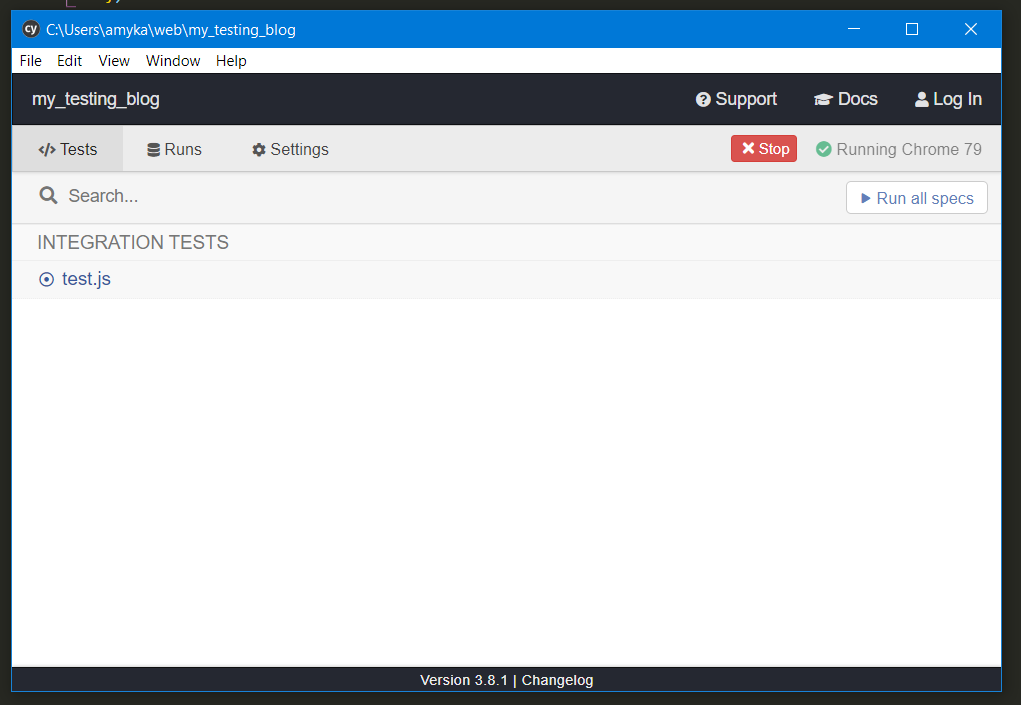
Cypress is easy to get started with, after installing it in your project (or globally), run cypress open, it will generate a folder and files for you, including sample tests. To write tests, create new files under cypress/integration/ . When running the tests, cypress open launches the Cypress task runner, where you can run your tests and view the results in a browser window.
Cypress uses the Chai assertion library for tests, it may be a little confusing if you haven’t used anything similar, but will start making sense once you get started.
// Name of Test
describe('Blog Homepage', () => {
    // Runs at the start of this test
    before(() => {
        // Visit our website in the Cypress browser
        cy.visit('http://localhost:65519')
    })

    // Assertion - title should contain specific text
    it('contains "My Testing Blog" in the title', () => {
        cy.title().should('contain', 'My Testing Blog')
    })
})
You can add extra tests within your describe function, a list of all the assertions and checks that you can run is available in the Cypress docs. You can check for elements on the page, and click or navigate between the pages to ensure that the app works as it should.
// Find the element with the `feed` class name and check that there's an article inside it
it('Contains posts in blog feed', () => {
    cy.get('.feed').find('article')
})

// Check that all articles on the page contain a heading
it('All posts contain a title', () => {
    cy.get('article').get('h2')
})

// Check that you can click on the post title link
it('Can access posts via article title', () => {
    cy.get('article')
        .first()
        .find('a')
        .click()
})
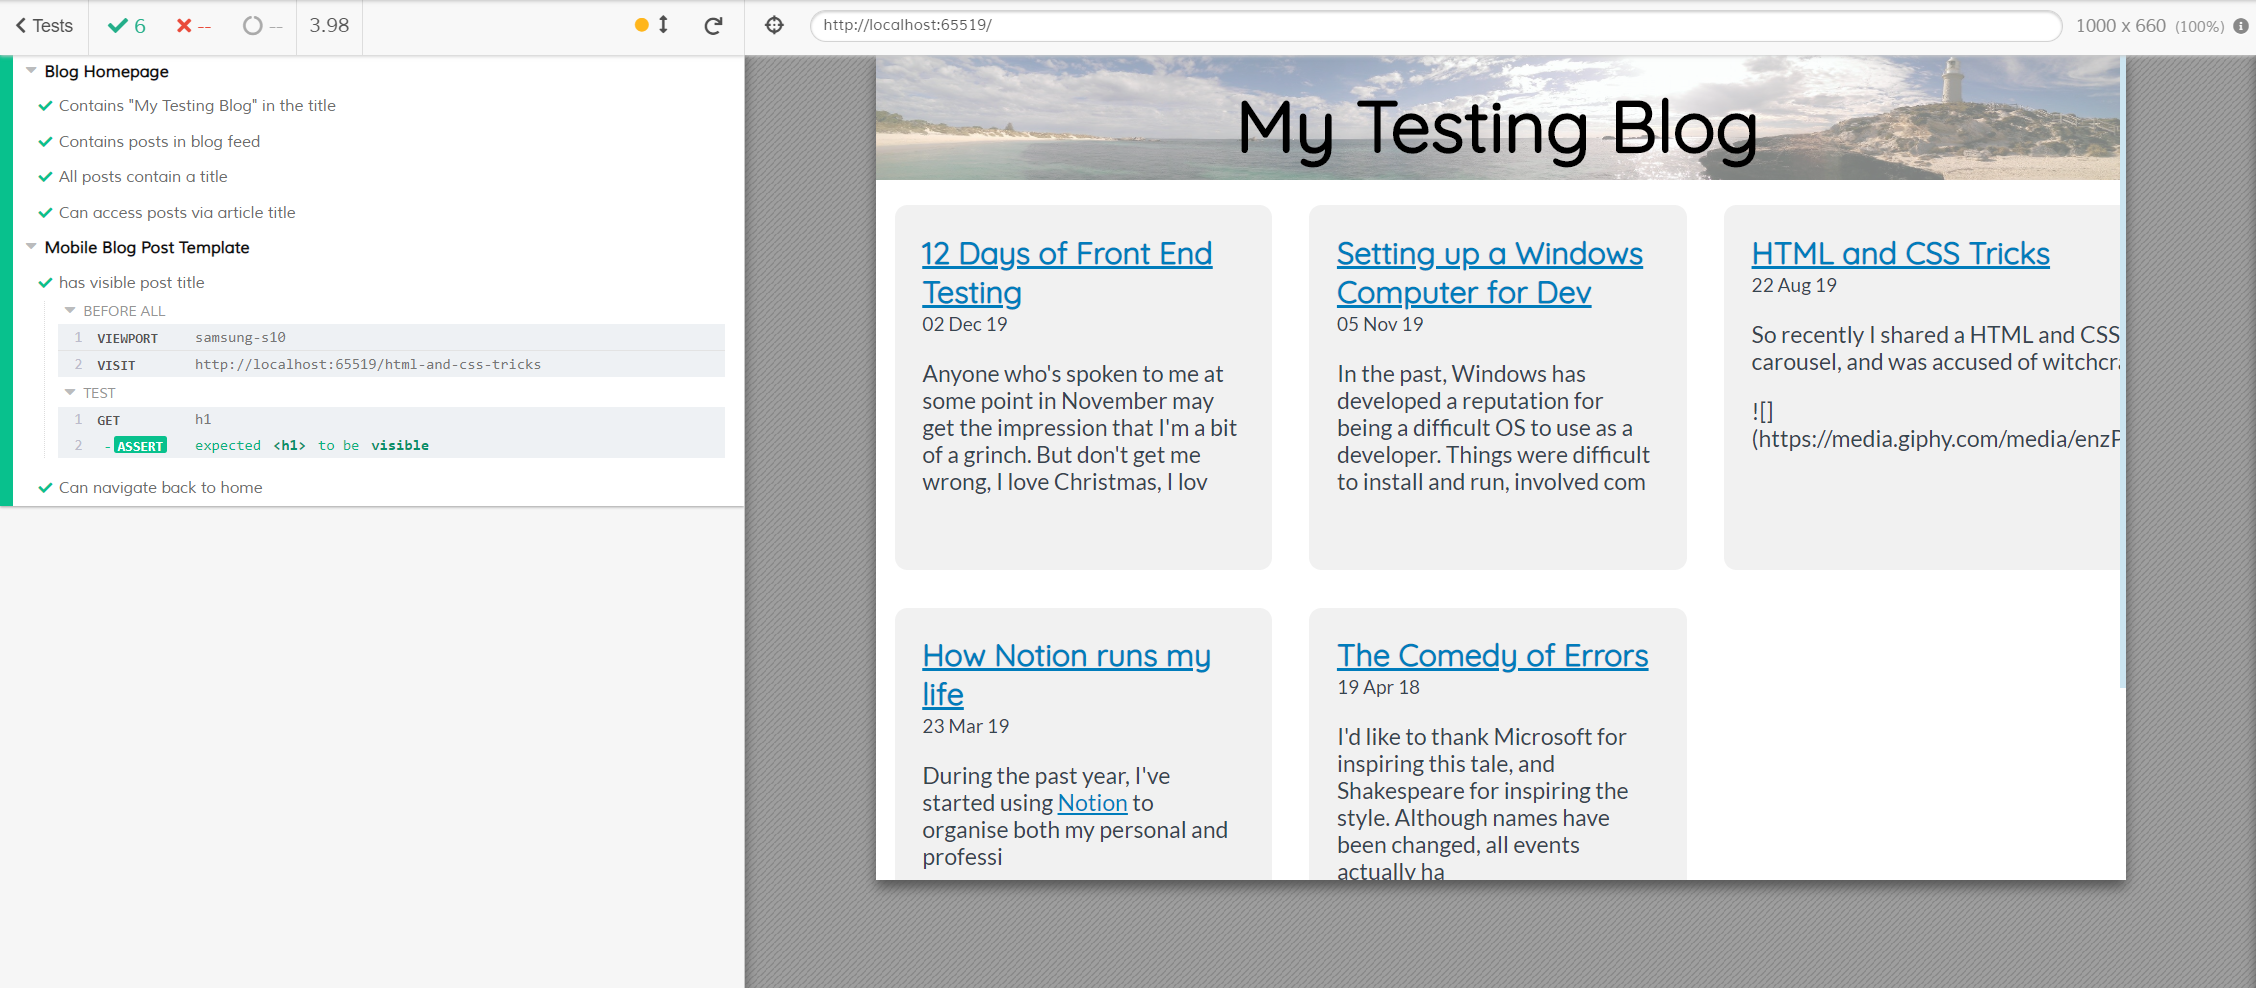
You can define extra tests in a new describe function, and set the viewport to run tests on various devices and screen sizes.
describe('Mobile Blog Post Template', () => {
    before(() => {
        cy.viewport('samsung-s10')
        cy.visit('http://localhost:65519/blog-post')
    })

    it('has visible post title', () => {
        cy.get('h1').should('be.visible')
    })

    it('Can navigate back to home', () => {
        cy.get('.site-title').click()
    })
})
When running the tests, Cypress will load a new Chrome window and you can view it running through the tests. If one of the tests fails, you can hover over each of the steps and see what is happening.
There are many more tests that you can run with these tools, or with other types of front end testing (for example, performance testing or HTML validation). Hopefully this has given you a bit of an insight to front end testing and somewhere to start with your project.